YouTube Studio turns raw viewing behavior into signals you can act on. The problem is that most creators glance at totals and miss the patterns that drive growth. This deep dive shows you how to read YouTube Studio like an analyst and an editor.
You will map symptoms to the one report that answers them, use Key Moments to plan specific edits, segment data in Advanced Mode before you change anything, and run a simple two-week optimization loop that improves results without guesswork.
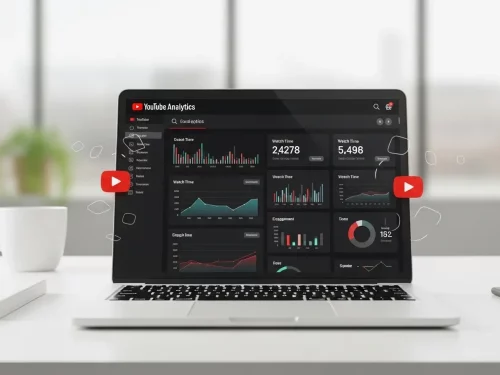
What Is YouTube Studio Analytics, And How To Open It?
YouTube Studio Analytics is the reporting area inside YouTube Studio. It shows how viewers discover your content, how long they watch, who returns, and how different formats behave.
- Path To Analytics: YouTube Studio → Analytics
- Tabs: Overview, Reach, Engagement, Audience
- Format Filter: All Content, Videos, Shorts, Live
- Advanced Mode: Analytics → Advanced Mode for comparisons, dimensions, and exports
Use the tabs for fast context and use Advanced Mode for all real decisions.
Overview Tab: Read Health Before You Diagnose
Path: Analytics → Overview. The Overview tab is your health check. Confirm direction here, then open the report that explains why.
1. Views
Total plays in the selected period, best used to compare scale against similar videos and time ranges.
2. Watch Time
Total time viewers spent watching, a core success signal that rises when retention strengthens or more sessions occur.
3. Average View Duration
The average time watched per view, a direct read on pacing and structure that you should pair with Audience Retention for edit decisions.
4. Subscribers
Net subscribers gained or lost, a loyalty indicator that should align with topic and packaging, or it will slip even as views rise.
5. Estimated Revenue (if monetized)
Estimated earnings from ads and other features, useful for business context rather than for discovery analysis.
Reach Tab: Measure Distribution And Choice
Path: Analytics → Reach. Reach explains how often YouTube shows your thumbnail and how often viewers choose it.
6. Impressions
The count of times your thumbnail appeared on eligible surfaces, which tells you how much distribution you are getting before viewers decide.
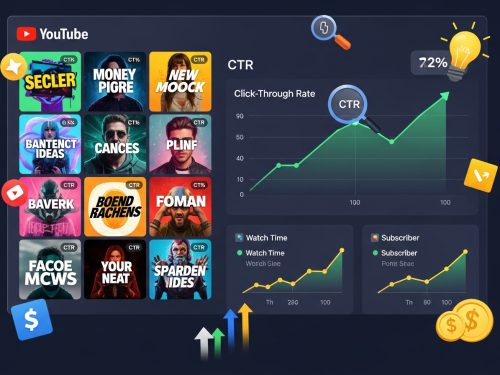
7. Impressions Click Through Rate
The percentage of impressions that became views, a measure of choice on surfaces that reveals packaging fit when compared over the first few days.
8. Views and Unique Viewers
Total plays and estimated distinct viewers viewed together to judge both scale and the size of your true audience.
9. Traffic Source Types
The breakdown of discovery via YouTube Search, Suggested Videos, Browse Features, External, and Channel Pages, which you use to match titles, thumbnails, and sequencing to the winning source.
Engagement Tab: Improve Watch Time And Retention
Path: Analytics → Engagement, Engagement shows what viewers do after they click.
10. Watch Time
Total time watched for the selected period, the primary indicator that your content holds attention and deepens sessions.
11. Average View Duration
The average minutes or seconds watched per view, a clear pacing signal that points to slow openings or weak structure when low.
12. Average Percentage Viewed
The average portion watched across the video, a length-adjusted completion read that helps you pick target durations.
13. Audience Retention
A moment-by-moment curve of remaining viewers that highlights cut points, re-hook opportunities, and stable areas for Cards.
14. Key Moments For Audience Retention
A set of highlights, including Intro, Top Moments, Spikes, and Dips, that you translate into specific edits like moving the value claim forward or trimming off-topic segments.
15. Cards and End Screens
Interactive elements that push viewers to the next view, placed on stable retention zones and never on dips to protect session depth.
Audience Tab: Grow Returning Viewers And Program Timing
Path: Analytics → Audience. Audience tells you who watches and who returns.
16. Returning Viewers
People who came back in the period, the main loyalty signal you grow with series formats and consistent upload slots.
17. New Viewers and Unique Viewers
First-time and estimated distinct viewers that define top-of-funnel size and potential for conversion into returners.
18. Watch Time From Subscribers
The split of watch time from subscribers and non-subscribers, a fit check for your core audience that should rise on series uploads.
19. When Your Viewers Are On YouTube
A heatmap of active hours and days that guides upload timing and community post scheduling.
20. Top Geographies and Age And Gender
Location and demographic context you use for captions, language choices, cultural cues, and timing.
21. Other Channels Your Audience Watches and Other Videos Your Audience Watched
External viewing patterns that point to topics, lengths, and packaging your audience already prefers.
Must Read: Top 14 Metrics You Should Track in YouTube Analytics
Content Views By Format: Videos, Shorts, And Live
Path: Analytics → Content → filter Videos or Shorts or Live. Formats behave differently. Read them in their lanes.
22. Videos
Evaluate Average View Duration, Average Percentage Viewed, and Audience Retention together to tune hooks, segment density, and chapter structure.
23. Shorts
Read the Shorts card for Engaged Views and early drops, then optimize the first second and on-screen text for fast clarity.
24. Live
Monitor Concurrent Viewers and Chat Rate during stream and then repackage the replay as video on demand with a fresh intro and clean chapters.
Advanced Mode: Trend, Segment, And Compare
Path: Analytics → Advanced Mode. Advanced Mode is where decisions happen.
25. Secondary Dimensions
Use Traffic Source, Geography, Device Type, Subscription Status, and Content Type to segment performance before you make changes.
26. Typical Comparisons
Check Average View Duration By Traffic Source to see where packaging works, Average Percentage Viewed By Video Length Cohort to choose durations, and Views Per Unique Viewer to track replay value.
27. Exports
Keep a consistent CSV template and saved views so the team reads and reports the same way every week.
Open The Right Report For The Job
Start with a question and open the one report that answers it.
| Question | Report To Open | Exact Path | What To Look For | Decision Trigger |
|---|---|---|---|---|
| Why did views stall after day three | Impressions and Impressions Click Through Rate by source | Analytics → Reach → Key Metrics and Traffic Source Types | Impressions Click Through Rate trend by source over the last seven days | Repackage Title and Thumbnail for the weak source |
| Why are people leaving at minute one | Audience Retention and Key Moments For Audience Retention | Analytics → Engagement → Audience Retention | Intro steepness and first plateau timing | Reshoot or re edit the first thirty seconds |
| Which source produces the best watch time | Average View Duration by Traffic Source | Analytics → Advanced Mode → Secondary Dimension: Traffic Source | Average View Duration by source | Build End Screens and playlists that feed the winner |
| Did subscribers actually watch this upload | Watch Time From Subscribers | Analytics → Audience | Watch time split, subscribers versus non subscribers | Plan a follow up that speaks to core subscribers |
| Is length hurting completion | Average Percentage Viewed by length cohort | Analytics → Advanced Mode with saved groups | Average Percentage Viewed by cohort | Adjust target length for the series |
Audience Development Levers You Can Pull This Week
Paths: Analytics → Audience.
- When Your Viewers Are On YouTube: Post in high-density blocks.
- Watch Time From Subscribers: If low, schedule a video for your core audience.
- Views Per Unique Viewer: Rising values signal replay value. Identify the pattern and repeat it.
- Series Format and Timing: Pick a day and slot. Give viewers a habit to follow.
Build A Two-Week Optimization Plan For One Video
Small scheduled changes beat big reactive edits. Use this plan to improve any single upload.
- Day 0 to 1: Check the Realtime card, early Impressions Click Through Rate, and the first read of Audience Retention.
- Day 2 to 3: If Impressions Click Through Rate is weak, test a clearer Title and Thumbnail. Keep the video content the same.
- Day 4 to 7: If Average View Duration is weak, trim slow segments and add a mid-video re-hook.
- Day 8 to 10: Strengthen pathways with one new Card and a clearer End Screen that points to the next video.
- Day 11 to 14: Publish a related sequel or a community post that sends viewers back to the video and the playlist.
Create Saved Reports You Will Reuse
Path: Analytics → Advanced Mode. Create saved views so your team can get to answers quickly.
- Traffic Source Comparison View: Average View Duration and Impressions Click Through Rate by Traffic Source.
- Series Performance View: Saved group of related videos with Average Percentage Viewed and End Screen click rate.
- Weekly Export Template: One CSV format that feeds your dashboard without cleanup.
Common Pitfalls That Break Analysis
- Comparing Shorts with long tutorials or mixing formats in a single read.
- Changing Title, Thumbnail, and edits at the same time.
- Skipping segmentation in Advanced Mode and assuming one number explains everything.
- Overreacting inside the first twenty-four hours before trends stabilize.
Turn Studio Data Into Weekly Wins With EvenDigit
Data alone does not grow a channel. Decisions do. At EvenDigit, we turn the analytics into a plan. We have experience of 12+ years in digital marketing, 1200+ successful projects, and an award-winning team backed by Softude. You get experience, process, and clear outcomes.
What we set up for you:
- Saved views in Advanced Mode that your team can reuse every week.
- A packaging system for titles and thumbnails that lifts Impressions Click Through Rate.
- An edit list from Audience Retention and Key Moments that improves Average View Duration.
- Playlists, cards, and end screens that increase session depth.
- A two-week improvement loop for each upload, with simple rules to scale winners.
- Optional YouTube Ads to amplify proven videos without wasting budget.
What you can expect:
- Cleaner reports and faster decisions.
- Fewer wasted edits and more predictable gains..
- A channel that attracts the right viewers and brings them back.
If you want measurable growth, there is a lot to track, measure, and manage in YouTube Studio. Our experts know how to do it correctly, from reading Key Moments and Audience Retention to shaping titles, thumbnails, and pathways that lift results.
Connect with EvenDigit and let us brainstorm the best plan for your next campaigns so your channel grows with intent and clarity.