YouTube gives you a lot of numbers. Only a few decide whether your videos get shown, clicked, and watched. This guide focuses on the metrics that move growth.
You will get to know what these metrics are, where to find each metric in YouTube Studio, why it matters, and practical fixes when a number is weak.
We will also cover the differences between Shorts, long form, and live streams so your reporting matches the format. By the end, you will know which dials to watch every week and exactly how to use them to increase views, watch time, and returning viewers.
What Is YouTube Analytics and Where to Find These Metrics
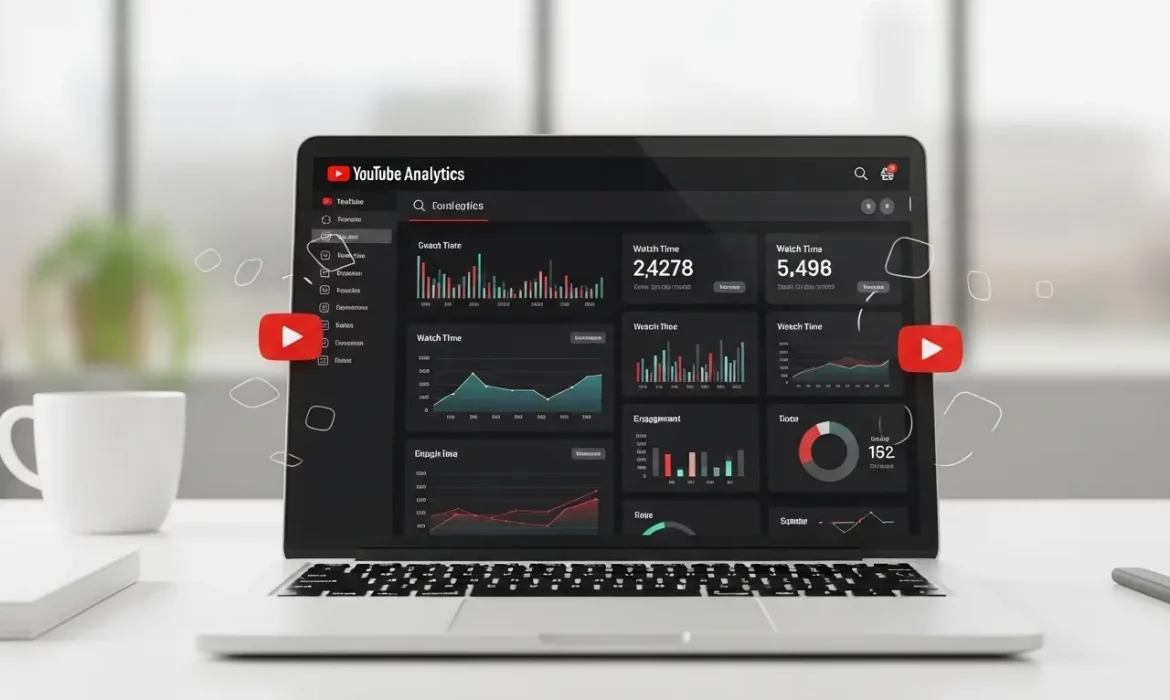
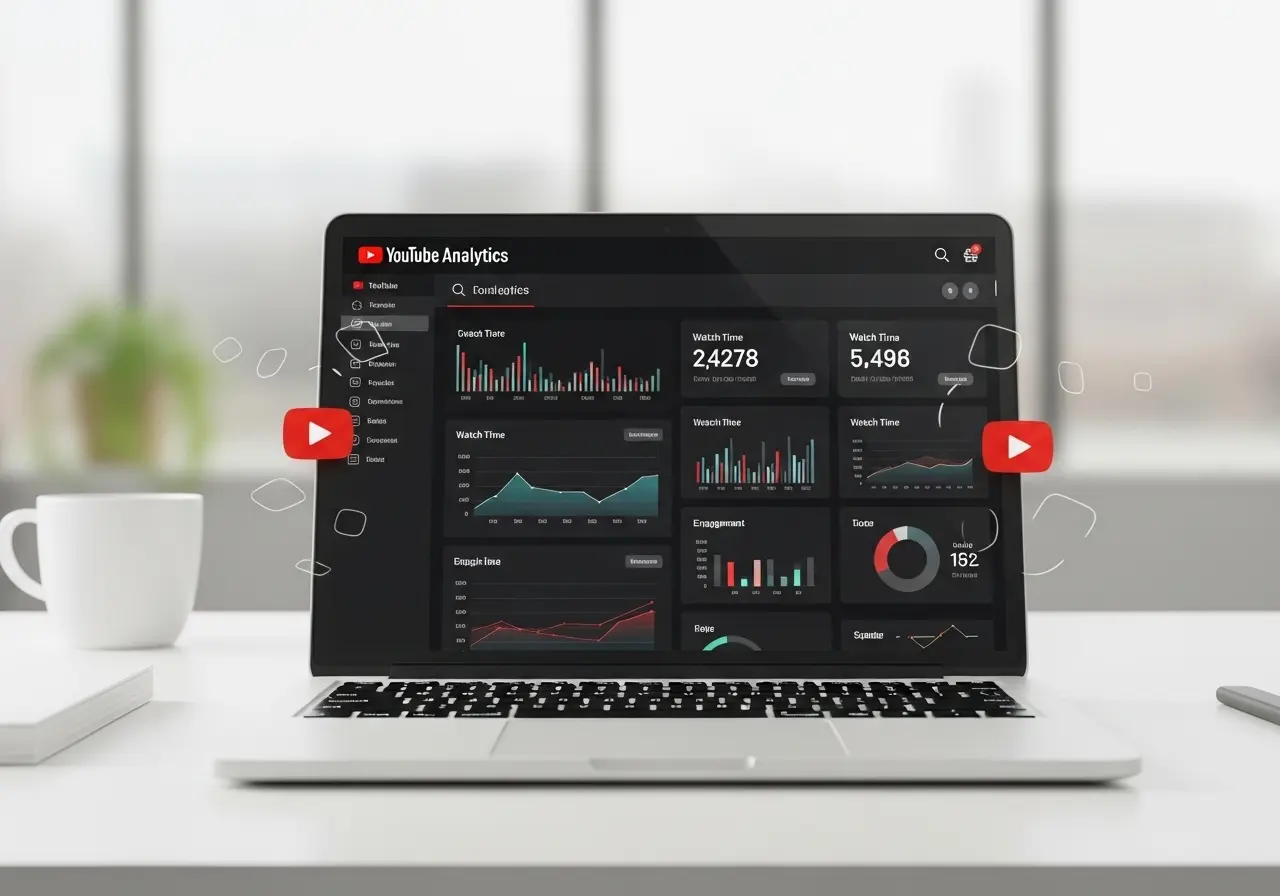
YouTube Analytics is the reporting suite inside YouTube Studio that shows how people discover, watch, and return to your content across Videos, Shorts, and Live.
It aggregates reach, engagement, and audience data so you can diagnose growth, compare performance over time, and decide what to publish next.
How to open it:
Go to YouTube Studio → Analytics. Use the top filter to view content by All, Videos, Shorts, or Live. Click Advanced mode in the top right when you need comparisons, extra dimensions, or CSV exports.
Where to find the key metrics, fast
● Impressions and CTR
Analytics → Reach → Key metrics card
● Watch Time and Average View Duration
Analytics → Engagement → Key metrics card
● Audience Retention and Key Moments
Analytics → Engagement → Audience retention
● Traffic Sources
Analytics → Reach → How viewers found your content
Use the table to break down Search, Suggested, Browse, External
● Returning vs Unique Viewers
Analytics → Audience → Returning and new viewers card
● Subscribers
Analytics → Audience for subscriber insights
Analytics → Overview shows subscribers gained in the period
Other useful places
- Overview shows a high-level card set for views, watch time, subscribers, and top content.
- Audience also includes demographics, watch time from subscribers, and when your viewers are on YouTube.
- Research helps you explore what your audience and the broader YouTube audience are searching for.
- Advanced mode lets you compare videos, date ranges, traffic sources, geography, devices, and export reports.
Reach and Discoverability: Are People Seeing and Choosing Your Videos
Goal: YouTube must show your thumbnail to the right people, and those people must choose it.
1. Impressions
The number of times your thumbnail was shown on YouTube surfaces that count toward this metric. Impressions are the top of your funnel inside YouTube.
Where: Analytics → Reach → Key metrics card.
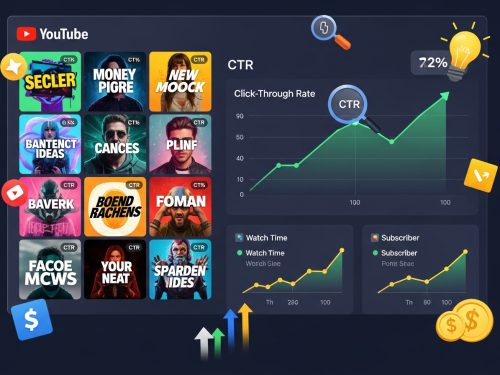
2. Impressions click-through rate (CTR)
The percent of impressions that became views. Use CTR with AVD and Retention to avoid clickbait that drops viewers fast. Expect CTR to spike at launch, then normalize. Improve with aligned titles and thumbnails, a clear first frame, and consistent packaging.
Where: Analytics → Reach → Key metrics card.
3. Views vs Unique viewers
Views show total consumption. Unique viewers estimate how many distinct people watched in the period. Use both to understand scale and audience size.
4. Traffic sources
See where discovery happens: YouTube Search, Suggested videos, Browse features, External, and more. Double down on the source that already works. For example, if Suggested is high, create sequels and use end screens that keep viewers on the same topic.
Engagement and Content Quality: Do Viewers Stay
Goal: Increase total Watch Time and keep viewers through the video.
5. Watch Time
Total minutes watched. This is a core quality signal for YouTube recommendations. Lift it with tighter hooks, faster context in the first 30 seconds, and strong mid-video re-hooks.
6. Average View Duration and Average Percentage Viewed
AVD is the time watched per view. Average Percentage Viewed shows what portion of the video people watch. Read with your retention graph to locate dead zones and cut them.
7. Audience Retention and Key Moments
The retention report shows where viewers stay, dip, or spike. Key Moments highlights the intro performance, continuous segments, and spikes or dips. Use this to improve your opening, place cards where retention is stable, and remove segments that lose viewers.
8. Rewatches and spikes
Sharp spikes often mean replays or heavy scrubbing. Put chapters or on-screen labels at those points and consider creating a focused follow-up.
Audience and Loyalty: Who Watches and Who Returns
Goal: Grow people who come back.
9. Returning vs unique viewers
Returning viewers measure loyalty and programming fit. If returning is flat but unique viewers rise, you are attracting new people but not keeping them. Fix with repeatable series, consistent upload slots, and topics that build on each other.
10. Subscribers and watch time from subscribers
Subscribers help early velocity and future reach. Track watch time from subscribers to confirm you are serving your core audience, not only casual viewers.
11. Demographics and geography
Use age, gender, and location to time uploads, refine language, add captions, and choose cultural references that land with your audience.
Interaction and Pathways: What Drives the Next Click
Goal: Build session depth so one view becomes many.
12. Card clicks and end screens
Cards and end screens move viewers into the next relevant video or playlist. Place them during stable retention segments so clicks do not cut sessions short.
13. Playlist engagement
Check views per playlist start and average time in playlist. Curate tight topic playlists so viewers can binge the subject without leaving your channel.
14. Comments, likes, shares
These show resonance. Track them, but do not chase them alone. If they rise while AVD falls, adjust the content before the call to comment or share.
Shorts vs Long Form vs Live: Metric Nuances in 2025
YouTube reports the same core ideas across formats, but the cards differ.
- Shorts: The Engagement card includes Engaged views. Retention curves behave differently because viewers swipe. Packaging matters in the first and second. Keep text large and hooks immediate.
- Long form: focus on AVD, Key Moments, and chapters. Add re-hooks near natural dips.
- Live: track concurrent viewers and chat rate. Repurpose lives into edited VOD with a sharp intro to sustain watch time after the stream. (Best practice based on Studio reporting layout.)
Advanced Mode and Reporting: Trend, Segment, Compare
Use Advanced mode when you need clear decisions.
- Compare CTR by traffic source. A title that works in Search may not work in Suggested.
- Compare retention by topic or length to find your ideal video duration.
- Export CSV for monthly and quarterly reports. Build groups to compare series performance.
For additional interpretation ideas, see expert roundups that group metrics by KPI and cadence. They are useful when you set weekly, monthly, and quarterly reporting.
Benchmarks and How to Judge “Good”
Do not chase someone else’s number. Judge your channel against your own baseline and trend lines. Compare similar videos by topic and length over the last 28 to 90 days.
Improve CTR by testing packaging. Improve AVD by fixing pacing. Improve retention by editing out the dips the graph reveals. That improvement curve is what matters. For extra context, industry summaries can help you set review cadences, but use your data first.
Cheat Table: Metric, Meaning, Fix
| Metric | Where to find it | What it means | Why it matters | Fix if low | Related check |
|---|---|---|---|---|---|
| Impressions | Reach → Key metrics | How often your thumbnail was shown on eligible YouTube surfaces | Top of the in-platform funnel | Improve topic match and packaging | CTR trend |
| Impressions CTR | Reach → Key metrics | Percent of impressions that became views | Measures choice on surfaces | Test titles and thumbnails. Align promise and delivery | AVD, retention |
| Views, Unique viewers | Overview and Reach | Total consumption and distinct audience size | Scale and true reach | Create a series to turn uniques into returning | Returning viewers |
| Watch Time | Engagement → Key metrics | Total minutes watched | Core quality signal | Tighten for the first 30 seconds. Add mid-video re-hooks | Retention graph |
| Average View Duration | Engagement → Key metrics | Time watched per view | Pacing and editing quality | Cut dead air. Use chapters and pattern breaks | Average % viewed |
| Audience Retention, Key Moments | Engagement → Retention | Intro performance and dips or spikes | Shows exact edit points | Remove dip segments. Place cards at stable spots | Rewatches, spikes |
| Traffic Sources | Reach → How viewers found your content | Search vs Suggested vs Browse vs External | Where discovery happens | Double down on the winning source with sequels and end screens | CTR by source |
| Returning vs new or unique viewers | Audience | Loyalty and format fit | Predictable growth engine | Consistent schedule and series. Serve the core topic | Watch time from subscribers |
| Card clicks and End screens | Engagement and individual video cards | Pathways to the next view | Builds session depth | Place during stable retention. Link close topics | Playlist metrics |
| Demographics and location | Audience | Who watches and where | Packaging, captions, timing | Localize references. Add subtitles. Time uploads | Device mix |
Make Your Channel Work Like Your Business With EvenDigit
If you want steady views, stronger watch time, and real leads from YouTube, you need more than raw numbers. You need a team that turns data into action.
At EvenDigit, our specialists plan your content, script tighter hooks, design titles and thumbnails that lift CTR, and edit for retention. We set a clear programming calendar across Shorts, long form, and Live.
We run YouTube Ads to scale what works, then manage it through clean analytics, weekly testing, and simple reports tied to your business goals.
We measure the big six first, fix the weak link, and build reliable pathways with cards, end screens, and playlists. You get a channel that attracts the right viewers, keeps them watching, and moves them to the next step with confidence.
Ready to see what your channel can do this quarter? Connect with our experts. We will review your top videos, identify quick wins across CTR, AVD, and retention, and share a focused growth plan you can start this week.
Your YouTube marketing should pull its weight. Let us help you make it happen.
Frequently Asked Questions
What is a good CTR on YouTube?
There is no universal good number. Judge CTR against your own baseline and by traffic source. Improve by testing titles and thumbnails, and by aligning the promise with the video’s first 30 seconds.
Does Watch Time affect recommendations?
Yes. Watch time and related engagement signals help YouTube understand if viewers are satisfied, which supports broader distribution. Improve by tightening intros and adding mid-video re-hooks.
Where do I find Key Moments in YouTube Studio?
Analytics → Engagement → Audience retention. The report highlights intro performance, continuous segments, and spikes or dips.
What metrics matter most for Shorts vs long form?
Shorts use the same core ideas, and the engagement card includes Engaged views. Long form relies more on AVD and Retention. Lives add concurrent viewers and chat signals.
How often should I report on YouTube metrics?
Weekly for packaging and retention tests. Monthly for topic and series performance. Quarterly for channel strategy and format changes. Use Advanced mode to compare groups and export CSVs.